Explanations for tabular data (classification) – Explainable AI
Once the model is deployed successfully, open the Jupyter lab from the workbench created and enter the Python code given in the below steps.
Step 1: Input for prediction and explanation
Select any record from the data. Modify it in the below mentioned format and run the cell:
instances_tabular=[{“BMI”:”16.6”,”Smoking”:”Yes”,”AlcoholDrinking”:”No”,”Stroke”:”No”,”PhysicalHealth”:”3”,”MentalHealth”:”30”,”DiffWalking”:”No”,”Sex”:”Female”,”AgeCategory”:”55-59”,”Race”:”White”,”Diabetic”:”Yes”,”PhysicalActivity”:”Yes”,”GenHealth”:”Very good”,”SleepTime”:”5”,”Asthma”:”Yes”,”KidneyDisease”:”No”,”SkinCancer”:”Yes”}]
Step 2: Selection of the endpoint select
Run the below lines of code to select the endpoint where the model is deployed. In this method, we are using the display name of the endpoint (instead of the endpoint ID). “tabu” is the endpoint name where the model is deployed. Full path of the endpoint (along with the endpoint ID) will be displayed in the output:
endpoint_tabular = gcai.Endpoint(gcai.Endpoint.list(
filter=f’display_name={“tabu”}’,
order_by=’update_time’)[-1].gca_resource.name)
print(endpoint_tabular)
Step 3: Prediction
Run the following lines of code to get the prediction from the deployed model:
tab_endpoint = gcai.Endpoint(endpoint_name)
tab_explain_response = tab_endpoint.explain(instances=instances_tabular)
print(tab_explain_response)
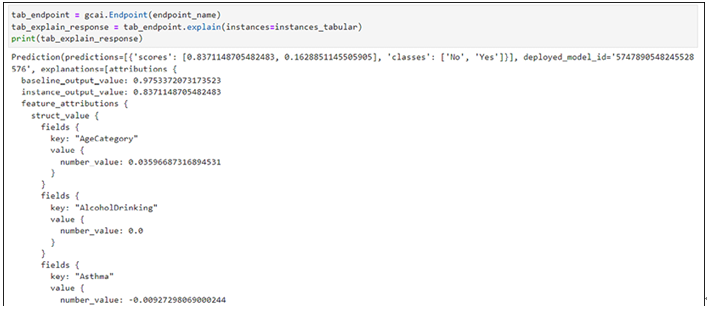
Prediction results will be displayed as shown in the following figure which contains classes and the probability of the classes:

Figure 10.23: Predictions from deployed tabular classification model
Step 4: Explanations
Run the following lines of codes to get the explanations for the input record:
key_attributes = tables_explain_response.explanations[0].attributions[0].feature_attributions.items()
explanations = {key: value for key, value in sorted(key_attributes, key=lambda items: items[1])}
plt.rcParams[“figure.figsize”] = [5,5]
fix, ax = plt.subplots()
ax.barh(list(explanations.keys()), list(explanations.values()))
plt.show()
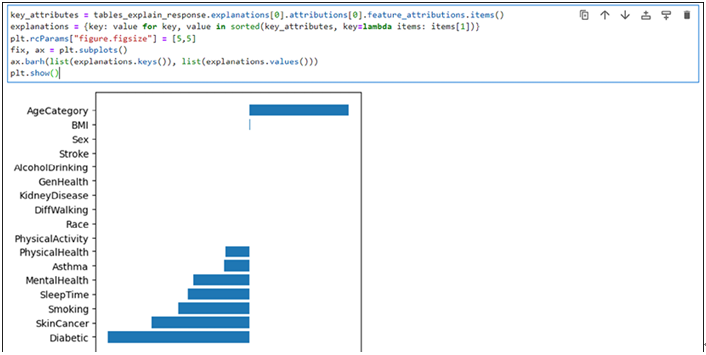
Shapley value is provided in the explanations for each of the features and it is visualized as shown in the following figure:

Figure 10.24: Explanations from deployed tabular classification model
Deletion of resources
We have utilized cloud storage to store the data, delete the files from the cloud storage manually. Dataset is created for image data and tabular data to delete them manually. Classification models for image and tabular are deployed to get the predictions and explanations, ensure to un-deploy the model from the endpoints and delete the endpoints (Refer Chapter 2, Introduction to Vertex AI & AutoML Tabular and Chapter 3, AutoML Image, text and pre-built models). Predictions are obtained using workbench, ensure to delete the workbench instance.